


Read More
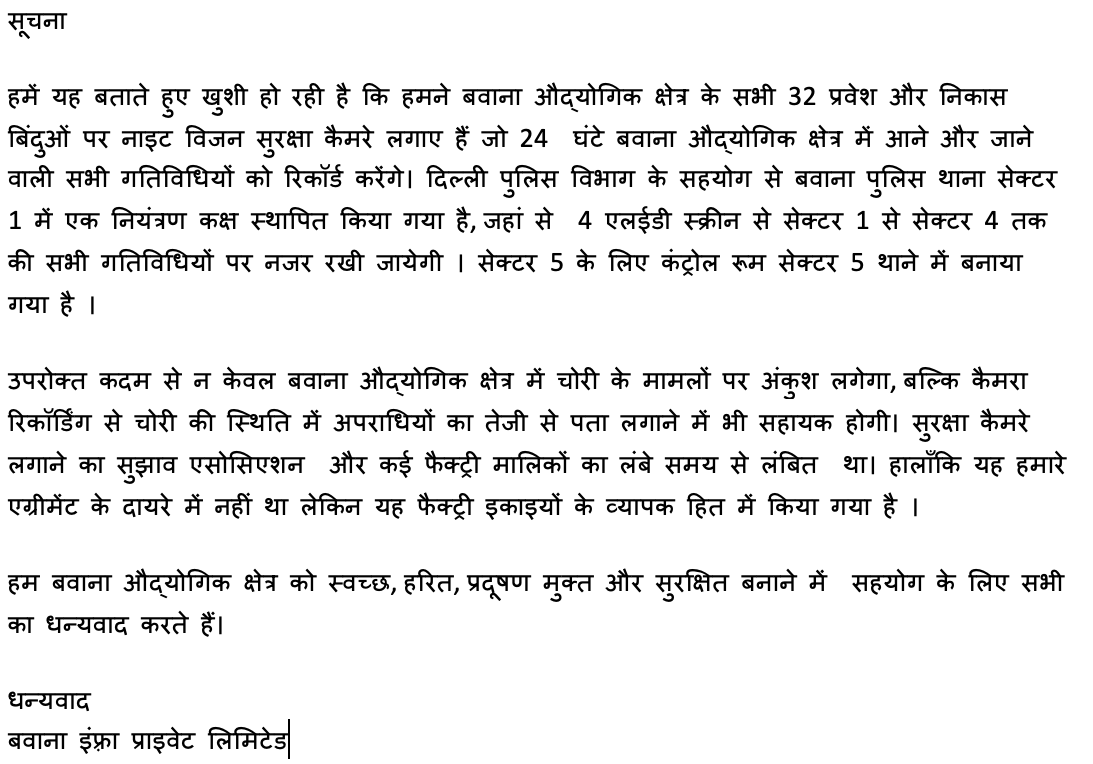
The development of Bawana Industrial Area was entrusted to DSIIDC be the GNCTD in 1999. The objective of developing this Industrial estate to the industries with all requisite infrastructures. It also provided a planed industrial setup with appropriate infrastructure for the relocation of non-conforming industries. DSIIDC developed Bawana Industrial Area with all requisite infrastructure and faculties. With the advent of time and use of infrastructure facilities/assets, the condition today is not state of the art and is deteriorating with the time. In order to overcome such situation and developing a sustainable framework for industrial areas management, DSIIDC is now actively seeking private sector efficiencies in managing all infrastructure assets and the area as a whole through this Project.
Bawana is located 23 km in North-West of Delhi and comes in urban extension Zone 'N' of Delhi, Zone N is Bonded by Western Yamuna Canal on North-East, Rohtak Railway line south, 100M wide road east and Haryana state boundary on West & North west. Bawana Village, located 30 Km from Connaught Place in the North-West of Delhi is located in urban extension Zone 'N' of Delhi. Zone N is bound be Western Yamuna Canal on North-East and Rohtak Railway line in South. Bawana Industrial Area is situated on the West of Bawana Town and falls within the revenue village of Bawana, Holambi Kalan and Holambi Khurd. Narela Industrial Complex is about 7 Km from the study area to the north-west. The National Highway-1 (G.T. Kranal road) passes at a distance of 10 Km from the Industrial Area. Two major proposed roads-80M Master plan road on the North-West and 100M master plan road on the south-east of the Industrial Area and a proposed MRTS (metro) link to Bawana & Holambi Kalan are planned to ensure connectivity of the industrial Area with the rest of the NCR. The proposed roads are supposed to act as major corridors between G.T. Karnal road in the north and Rohtak Industrial Complex, Kanjawala, Tikri Kalan and Narela Industrial Complex. These roads need to be constructed as originally planned to ensure connectivity of the Industrial Area with the rest of National Capital Region.
Land Use & Distribution
Bawana Industrial Area is spread over an area of 778.17 Ha (1922.10Acres). 53% of the area is under industrial plots, 14% under recreational and 6% under commercial.
Source: DWG no. DSIDC/RITES/UD/2001/Land use plan (Revised)
Land Use |
Area (Ha) |
Area (Acres) |
% |
Industrial |
414.13 |
1022.9 |
53.22 |
Residential |
9.13 |
22.55 |
1.17 |
Commercial |
43.91 |
108.46 |
5.64 |
Recreational |
106.36 |
262.71 |
13.67 |
Common |
34.56 |
85.36 |
4.44 |
Utilities |
30.13 |
74.42 |
3.87 |
Circulation |
139.96 |
345.7 |
17.99 |
Total |
778.18 |
1922.1 |
100 |
The Bawana Industrial Area is divided into 5 sectors; further divided into clusters 7 ha each, so as to provide hierarchy of necessary facilities and services to estimated 27,000 industrial workers in a sector. These clusters have industrial plots with sizes varying from 100 to 250sqm.
Each sector and cluster of Bawana Industrial Area is planned so as to provide necessary facilities and services to cater to the industrial requirement.
Plot Area/Size (Bases on Bawana Industrial Source)
The Bawana Industrial Area consists of 16312 Industrial plots. The details of industrial plots in the Industrial area are as below:
Sector |
Plot Size |
Total |
|||||
100 Sqm |
150 Sqm |
200 Sqm |
250 Sqm |
100 Sqm |
150 Sqm |
||
Sector-1 |
1588 |
913 |
186 |
471 |
3158 |
Sector-1 |
1588 |
Sector-2 |
1838 |
922 |
120 |
557 |
3437 |
Sector-2 |
1838 |
Sector-3 |
3787 |
1954 |
445 |
1479 |
7665 |
Sector-3 |
3787 |
Sector-4 |
417 |
203 |
73 |
124 |
817 |
Sector-4 |
417 |
Sector-5 |
603 |
251 |
97 |
284 |
1235 |
Sector-5 |
603 |
Total |
8233 |
4243 |
921 |
2915 |
16312 |
Total |
8233 |
Industries and Population (Based on Bawana Institutional Source)
Industry |
No. units |
Direct Worker Population |
Food Products & Beverages |
65 |
241 |
Wearing Apparel : Dressing and Dyeing of fur |
42 |
222 |
Publishing, Printing & Reproduction of Recorded Media |
234 |
722 |
Chemicals and chemical Products |
50 |
231 |
Electrical Machinery and Apparatus |
379 |
2337 |
Rubber and Plastic Products |
677 |
5010 |
Basic Metals |
146 |
772 |
Fabricated Metal Products except Machinery &equipments |
195 |
1031 |
Machinery and Equipments |
100 |
529 |
Others |
61 |
226 |
Total |
1949 |
11321 |
Direct Employment 2009-primary survey |
11321 |
|
Floating Worker Population @ 20% |
2264 |
|
Total Worker Population |
13585 |
|
Total Estimated no. of Workers Population in Year 2021 |
96561 |
|
Total Estimated no. of Workers Population in Year 2026 assumed |
120000 |
|
The project involves construction /up-gradation of Roads, water, Sewerage, ETPs, Street lights, parks etc in 1st two year and then maintenance of the said facilities for next 13 years.
The BIDPL shall be entitled to collect revenues from the billing of water supply (in line with DJB tariff structure), effluent conveyance & treatment charges (as per other existing CETP society tariff structure) and Maintenance Charges (Likely to be Rs 10 per sqm of plot area per month) from all leased plots in the industrial estates. Rights for outdoor advertising and provision of value add services shall also be available to the Concessionaire as additional revenues. These additional revenues shall be subject to rules of applicable local authority (viz. MCD etc) and subject to payment of applicable taxes.
The status of existing facilities is enumerated below -:
Road Facilities
Bawana Industrial area is bound by 80.00 M Master plan road to the North, 100.00 M Master plan road to the south and 60.00 M Wide road to the West. The internal road to the South and 60.00 M Wide road to the west .the internal roads have a hierarchy of ROW ranging from 40.00 ,24.00,18.00 and 15.00to12 M. there is also provision for a 4.00 M wide Cycle track with 7.00 M wide green belt, on both sides of the sectors.
Details of various ROW in Bawana Industrial Area
Road Type |
Right of way |
Length(m) |
Total Area(sqm) |
Carriage way Width |
Carriage way Area |
Master Plan roads |
|||||
R-1 |
80 |
1710 |
136800 |
35.5 |
60705 |
R-2 |
60 |
6240 |
374400 |
31 |
193440 |
R-3 |
40 |
6500 |
260000 |
22 |
143000 |
TOTAL |
14450 |
771200 |
397145 |
||
Sector Road & Cluster Roads |
|||||
R-4 |
24 |
11720 |
281280 |
15 |
175800 |
R-5 |
18 |
24270 |
436860 |
12.5 |
303375 |
R-6 |
15 |
31620 |
474300 |
7.5 |
237150 |
R-7 |
12 |
54890 |
658680 |
5.5 |
301895 |
Total Sector Road & Cluster Roads |
122500 |
1851120 |
1018220 |
||
Cycle Track |
|||||
R-8 |
20 |
1980 |
39600 |
4 |
7920 |
R-9 |
18 |
5880 |
105840 |
4 |
23520 |
TOTAL |
7860 |
145440 |
31440 |
||
Water Supply
Water supply network has developed be DSIIDC. Piped water supply provided to the industrial units (the supply network and storage tanks) was constructed during the development of the industrial area. The Estimated demand of water at the time of inception of the industrial area was 28 MLD (6MGD), of which 25 MLD was for industrial, Commercial & Facilities and 3 MLD for Horticultural & fire water requirement to be provided by recycling the treated effluent. Against the total estimated requirement of 6 MGD, 1.5 MGD was proposed to be made available by DJB. For rest of the requirement 12 Tube wells are installed in the industrial area with an average yield of 650 LPM.
Length of distribution network: 1,44,200 M; Available total storage capacity: 11.35 ML. are 3 Underground water tanks of 2.5, 5.6 and million liters in sectors 2,3, & 5 respectively.
Water Demand (Assessed By DSIIDC)
As per requirement rehabilitation of distribution network 3%, i.e. 4,400 M length D.I pipe in 1st Yr, 100 to 250 mm dia. Alone with all necessary ancillary items has been taken in this project. Rehabilitation of distribution network as and when required has been provided in the project. Rectification and operational Of Defunct Pump (5 nos.) is provided to fulfill The Further Required Demand. Provision has made for Routine O & M, civil & electro-mechanical maintenance of Water Supply System.
Sewage and CETP / STP
One common effluent treatment plant (CEPT) of 35 MLD capacity is constructed to take care of the effluent from industries. Keeping in view the flat terrain of the industrial area, pumping of sewage is proposed through three intermediate pumping stations. It will ensure an average flow of 3,504 million liters per day (With Capacity 19.88 MLD, 6.20 MLD & 8.96 MLD) to CETP planned from different locations. The recycled water from CETP is supposed to be fit for horticulture or to be discharged into the Bawana Escape (canal) passing through the industrial area. As per DSIIDC source; Existing waste water generation is 2.18 MLD. Estimated waste water generation in year 2021 is 11.02 MLD and in year 2026 is 15.00 MLD.
To fulfill the required demand, Rehabilitation of conveyance system for 4200 m NP-3 RCC Hume Pipe of size 250 mm, 300 mm, 350 mm, 400 mm, 450 mm, 600 mm, 700 mm, 800 mm, 900 mm, and 1000 mm dia. In 1st Year has provided. Also 3Nos. Intermediate sewage pumping stations for further rehabilitation of conveyance system of 35 MLD CETP, as and when required has provided.
Operation, Routine & Periodic Maintenance up to 15 years of conveyance network, will be done by BAWANA INFRA DEVELOOPMEN PVT. LTD.
Storm Water Drainage
The total area of the Industrial Area has been divided into two parts by Western Yamuna Canal (WYC). A storm water drain, 'Bawana Escape' is passing through the Industrial Area. The drain is an escape provided to WYC by Haryana Irrigation Department in order to maintain water level in the WYC. The area South East of western Yamuna Canal is served by two drains namely Bawana Escape and Ghogna drain.
The run-off generated was estimated as 38.4 Cumecs (138240m3/hr). As per the proposal, Bawana Escape passing through the site is used as outfall, having a bed width of 4.6 m and a water depth of 1.5 m, which is at a distance of about 0.5 Km from the southern edge of the complex. Rain water Harvesting was proposed under three tiers at Scheme Level, Sector/Cluster level and Individual plot Level.
Generation: Estimation of storm water run-off of an area is based on the existing land-use of an area determines the quantum and distribution of permeable (soft/ earth) surfaces and non-permeable (built-up/paved) surfaces, which in turn translates into how much of the storm water is absorbed into ground and quantum of run-off generated. As occupancy of the industrial area will increase, the built-up area and paved surfaces will also increase, thereby increasing the generated run-off. The storm water drainage system is therefore designed on ultimate land-use.
Total Runoff Generation for Bawana Industrial Area (assessed by DSIIDC)
S. No. |
Scenario |
Run-off generation (m3/hr) |
1 |
Existing |
93627.00 |
2 |
Year 2021 |
117,150.36 |
3 |
Year 2026 assumed |
135000.00 |
As per Bawana Industrial Area source the total length of storm water drainage network is 2,86,140 m.
As per DSIIDC, presently the construction of damaged drainage network 8,600 m is to be done.
Municipal Solid Waste
The solid waste management system in Bawana needs to be augmented to ensure a sustainable waste management. There is no existing solid waste management system. The solid waste is usually dumped in open areas or in the green space. There are designated collection points (dhalaos) constructed at various points within the industrial area. There are, however, not maintained. Garbage dumped at the dhalaos is not removed; but the collected garbage is incinerated in the open at regular intervals.
As per DSIIDC the total quantum of solid waste generated aggregates to 72.71 tonnes per day. The types of waste generated include Municipal and Industrial Plastic Waste, the major portion being municipal in character. There is no mode of door-to-door collection of waste from the industrial units. Road sweeping is not carried out daily.
Waste Generation for Bawana Industrial Area (Assessed by DSIIDC)
S. No. |
Scenario |
TOTAL SOLID WASTE GENERATION |
Tonnes/day |
||
1 |
Existing |
73.71 |
2 |
Year 2021 |
89.41 |
3 |
Year 2026 assumed |
98.00 |
Street Lighting
All roads in Bawana Industrial Area have sufficient street lights. There are 4374 nos. street lights in the industrial area. Installation of new street lighting poles will require as per adequacy. Regular O&M ensuring street lighting for 10 hrs per day, Routine Maintenance, replacement of fixtures will require by time of time.
Payment of Energy Bills of electric power supplier will also done by the bidder.
Parking
Each sector has been provided with designated parking and loading/unloading area for use of the industries. Parking Area Allocated in Bawana Industrial Estate (Assessed by DSIIDC)
Sector No. |
Parking Area (Ha) |
Loading/Unloading area (Ha) |
Total area (Ha) |
1 |
0.69 |
0.39 |
1.08 |
2 |
1.77 |
0.00 |
1.77 |
3 |
0.64 |
0.87 |
1.51 |
4 |
0.26 |
0.25 |
0.51 |
5 |
0.00 |
3.19 |
3.19 |
Total |
3.36 |
4.70 |
8.06 |
Horticulture
The total area under greens and open spaces accounts for 237.25 Acres. Developments of green and open spaces are a need for environmental issue.


